I’ve been looking over Apple’s 3rd quarter results for fiscal year 2010. In case you haven’t heard Apple made some money last quarter, to the tune of $15.7 billion dollars in sales.
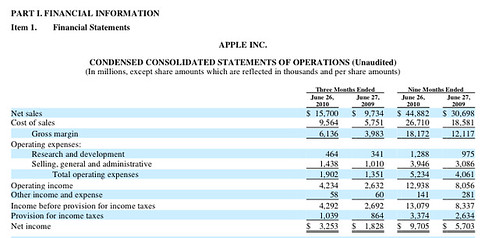
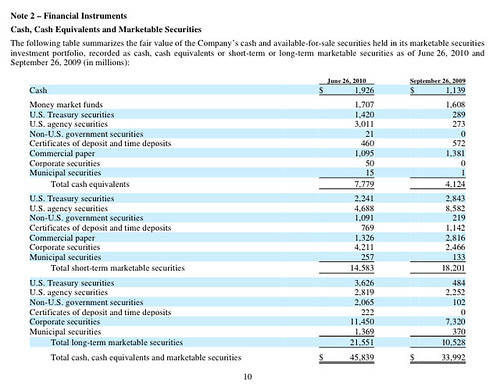
Apple had some gross margins of $6.13 billionion or approximately 39% gross margins. This means that Apple has around $45 billion in cash that they could use to buy just about anything that they want.
One of the more interesting changes is the increase in sales internationally. In the Americas, sales for the same quarter last year were $4.47 billion. The sales for 2010 are $6.22 billion. This is an increase of 39.1%. Within Europe, sales for 2009 were $2.50 billion and in 2010 sales were $4.16 billion. This is an approximate increase of 66.4% for Europe. Within Japan sales for 2009 were $560 million, while 2010 sales were $910 million. This is an increase of 62.5% in sales.
The biggest increase came from the Asia-Pacfic region. In 2009 sales were $703 million. In 2010, sales for the same region were $1.82 billion. This is an increase of 159.6%. Maybe it’s just me, but this is a HUGE increase. This growth is phenomenal and means that there is a pent up demand within the Asia-Pacific region.
The retail sales also increased from $1.49 billion in 2009 to $2.57 billion in 2010. This represents a 72.5% increase just in retail sales alone.
So what actually caused this increase in sales and profitability? Well, let’s look at the actual unit sales.
We’ll stat with the Mac sales. Within the Americas, unit sales went from 1.147 million to 1.358 million; this is an increase of 18.4% increase in Macs. Within Europe 2009, Mac sales went from approximately 626,000 to 914,000 Macs, a 46% increase. Japan’s Mac sales went from 108,000 to 129,000 units sold. This is an increase 19.44%. Asia-Pacific sales went from 230,000 to 394,000 units. This represents an increase of 71.3%. All of the numbers are quite significant. The total unit sales for 2009 went from 2.60 million to 3.47 million units. This is an overall increase of 33.3% in terms of unit sales.
One interesting statistic to note is regarding desktop sales versus portable sales. In 2009, desktops had 849,000 sales. Within the 2010 time frame, sales were 1.004 million units. This shows an increase of 18.25%. Portable devices went from 1.75 million units in 2009 to 2.46 million units in 2010. This is an increase of 40.7%. Overall, portable sales are 145% higher than desktop sales.
Macs aren’t the only thing that Apple sells. They have these devices called iPods, iPhones and iPad, so let us see how well this category did last quarter.
Due to last quarter being the first quarter of iPad sales, there are no percentage of change, but Apple does have some sales figures. The total number of iPads sold was 3.27 million units. This averages to 1.09 million per month of availability.
iPod sales were the only category that went down in terms of unit sales. In 2009, iPod sales were 10.21 million units and in 2010 iPod sales went down to 9.40 million units. This is a decrease of 7.91%.
iPhones, as expected, jumped from 5.208 million units in 2009 to 8.398 million units in 2010. This represents an increase of 61.25%.
Total net sales amongst all products went from $9.73 billion to 15.70 billion. An overall increase of 61.35%.
Overall, Apple had another stellar quarter. This quarter is better than any other quarter in company history including Q1-2010 which was the holiday quarter for 2009. It will be interesting to see how much Apple can make next quarter. I guess that is only three months away and we will see what happens at that time.
Photo Credit: Apple


